
The Blog of Arcanum Market Research
Arcanum Arcanorum: The Trend Machine
 The “Arcanum Arcanorum” is a different animal than the vast majority of W. D. Gann’s other techniques such as the Square of Nine, Gann Angles & Fans, and Cycles. Its roots lie in the numerology and Law of Vibration, and may be as old as recorded civilization. The Arcana was probably one of the first things shown to W. D. Gann by the family of Judah Touro. We deduce this by the illustration of the Arcanum on the cotton market in Gann’s book “The Truth Of The Stock Tape.”
In his earliest book, “Truth Of The Stock Tape,” W. D. Gann describes and demonstrates the simplest application of the Arcana on the cotton market. (Remember Judah Touro made his fortune trading cotton.) So the cotton market would’ve been the perfect introduction of the Arcana to a new initiate. Enter W.D. Gann.
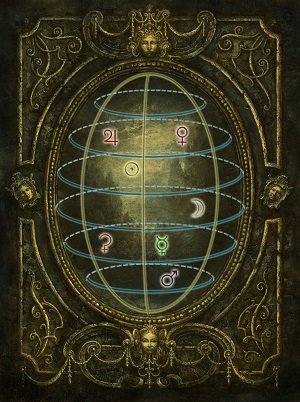
Applied to trading, the Arcanum predicts and forecasts both duration and direction of trends in advance. But the Arcana is different from chart indicators we are used to, such as a an ADX indicator. The Arcana measures supply and demand, as brought to our attention Mr. Gann many times in various places in his writings. The Arcana is described in “The Tunnel Thru The Air” in the narrative on Robert Gordon’s “mind-reading machine.” An offshoot of this machine is Gordon’s “Tel-Talk.” The idea is that the financial markets are a tangible representation of intangible global mass psychology. Gann claimed that his Arcana, or mind-reading machine, was able to predict global psychology and translate it into a leading supply/demand indicator. It’s function is to predict and forecast, in advance, the balance of buying or selling. On other words, Gann’s technique here could read the causes of buying and selling psychology on a global scale, and then predict these trends’ direction and durations even before they began.
Illustrated by the picture of the scales in Gann’s “Supply & Demand Letter,” (major clue there) this “trend machine” can be applied to all of Gann’s major time frames. These time frames were built around natural cycles, or “future cycles” described in that the chapter of the same name in “The Tunnel Thru The Air.” These are intra-day, intra-week, intra– month, yearly and two or three larger time frames.
W. D. Gann mentioned certain market trading configurations that telegraphed changes in trend, such as higher highs and lower lows. Many of these patterns are catalogued and illustrated in a book called “The Trading Methodologies of W. D. Gann,” by Hima Reddy. Gann looked to these market patterns both as an illustration and also a confirmation of the trends that the Arcana predicted. But at the base of what Gann was really writing about in “The Truth Of The Stock Tape” was learning how to read when this “trend machine” signaled a change in trend. While techniques such as “turn times” pegged exact highs and lows, and polarity lines confirmed the trend, it was this “trend machine” changing trend behind the scenes that Gann used as the true determination of what the trend will be in the future. Gann would wait for the trend to change, look for market confirmation, then wait further for a move against the trend, and then enter on that move against the trend.
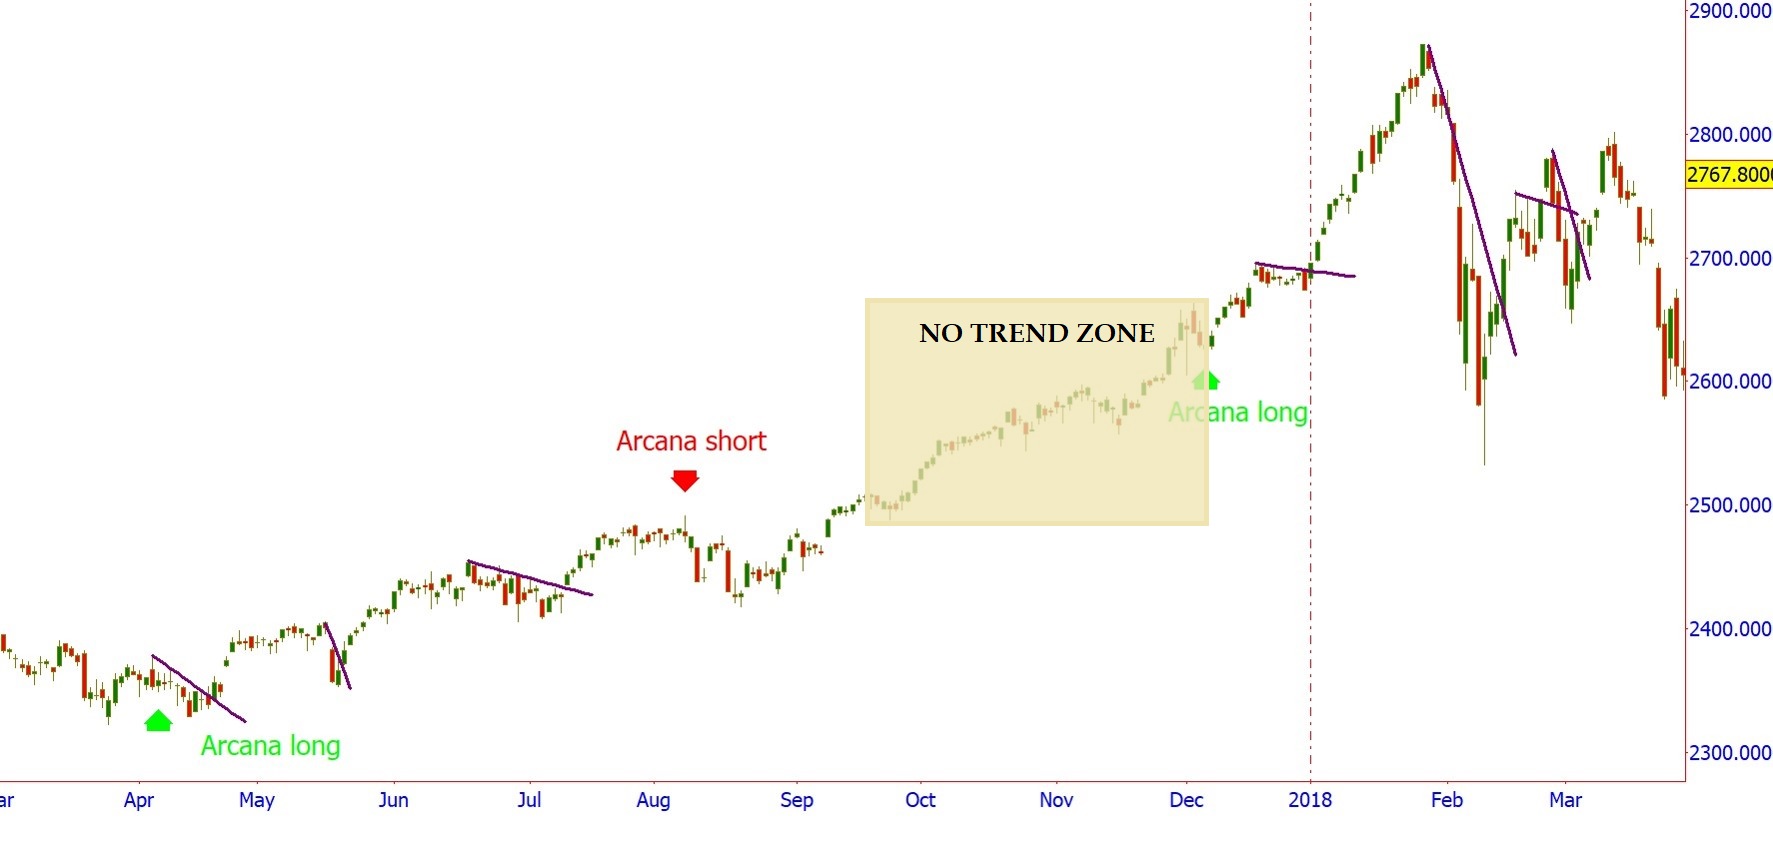
The chart below of the S&P 500 Index for 2017 into 2018 is from our 2017 Empire’ Newsletter. The trend change points that the Arcanum predicted in advance were drawn at the onset of 2017. Included in the chart are trendlines drawn when the market moved against the predicted trend. Following Gann’s method, one would wait for one of these to form and then enter in the direction of the trend when the market broke the trendline.
See below for an intraday example of the Arcanum trend prediction on gold futures for April 12th, 2016. First, look at our prediction of major trend change via Skype log…
DISCLAIMER: The examples above are given as demonstrations of technical analysis and are therefore hypothetical and not actual trades. They do not represent actual account results nor include the entirety of all predictions we make. Source of charts: Wave59.