
The Blog of Arcanum Market Research
FORECASTING PRICE AND TIME
In the pics below you will find our Skype log which includes the time the prediction of the exact time of the turn and price of the reversal was made. The calls were made well before the actual event- and then you will find the chart showing the actual market action for that day in that instrument. DISCLAIMER: The examples below are given as demonstrations of technical analysis and are in no way intended to be trading or investing advice. Source of charts: Wave59.
![]()
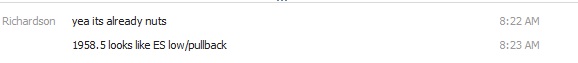
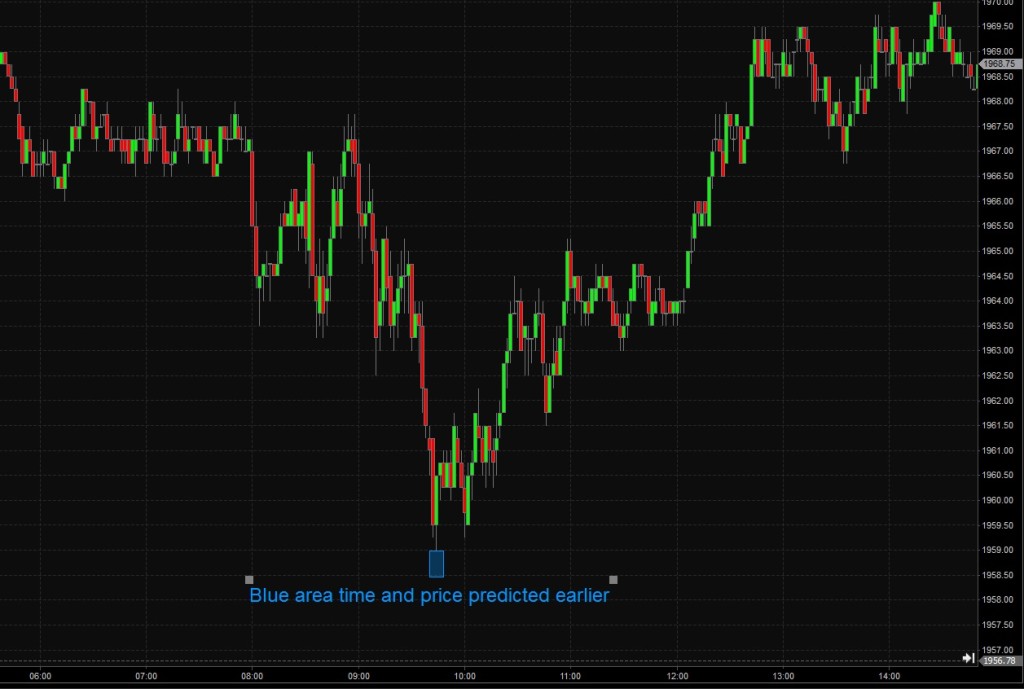
The above chart is of the ES $S&P futures contract for Monday, July 21st. On the chart, the price and time bottoms at 1859 at 9:48 right on the blue rectangle. Under the chart are transcripts. Reference the predicted prices and times of day (CST) the call and predictions were made. At 9:06 we forecast the 9:48 bottom to the minute. Before the market opened, we forecast the bottom price of 1958.50, which occurred at the 9:48 bottom time…only 2 ticks off! Impossible? Not really Gann did this all the time.
![]()
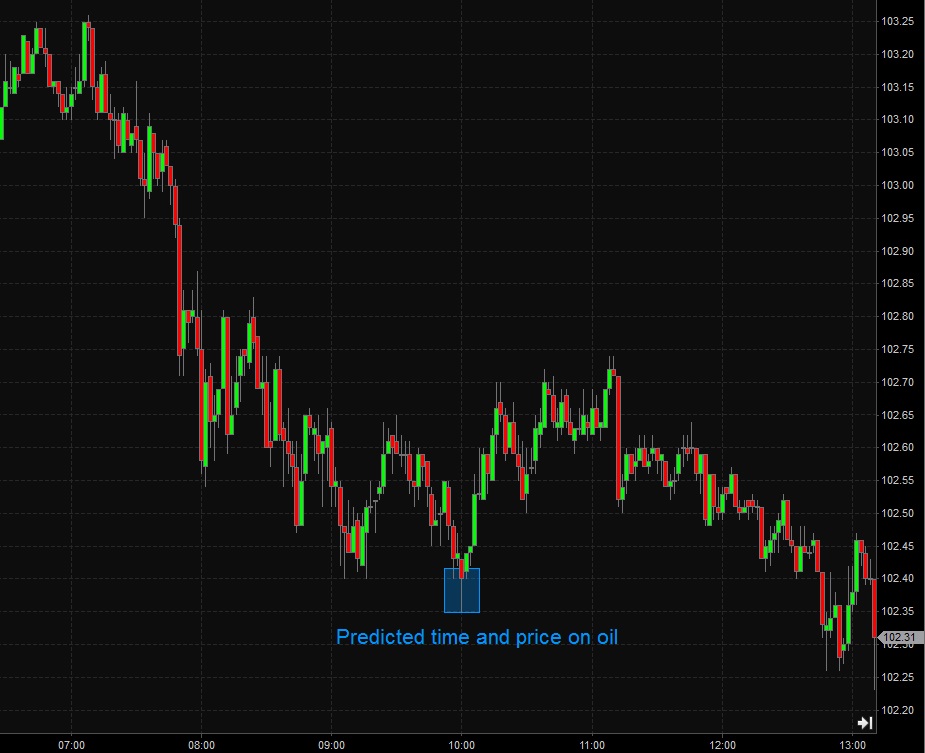
On the above crude oil chart notice the blue area of the price and time bottom. At 8:52 CST (over an hour earlier) we were able to accurately forecast the first bounce time on crude oil. Earlier we also alerted our clients to that area due to several large moving averages and a Gann price predicted bounce level. These occurrences are prevalent. And again, you too can learn this lost craft in our “W. D. GANN: MAGIC IN THE MARKETS” Course .