
FORECASTING INTRADAY TURN TIMES WITH GANN
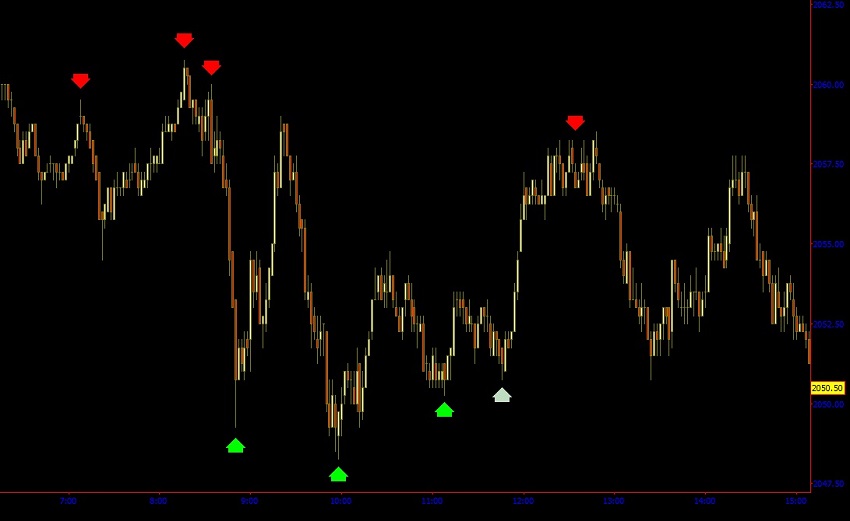
The true methods of W. D. Gann operate magnificently on an intraday basis. This also applies to Gann’s forecasting and prediction of turn times. Below are 2 examples from today, December 1st. The first chart is for the ES. The arrows are the predicted turn times from one of our favorite Gann methods: something we call “directions.” This technique is taught in our “W. D. GANN: MAGIC IN THE MARKETS” Course, and past students will know this as “Plan B.” This can be done every day Combined with other Gann methods as confirmations, its actually pretty easy to pick the turn times in a day down to the minute.
The arrows are drawn in advance of the trading day and predict the turn times. The different color arrows denote what kind of turn. White is ambiguous. The first chart blow is a 2 minute chart of the ES futures for December 1st.
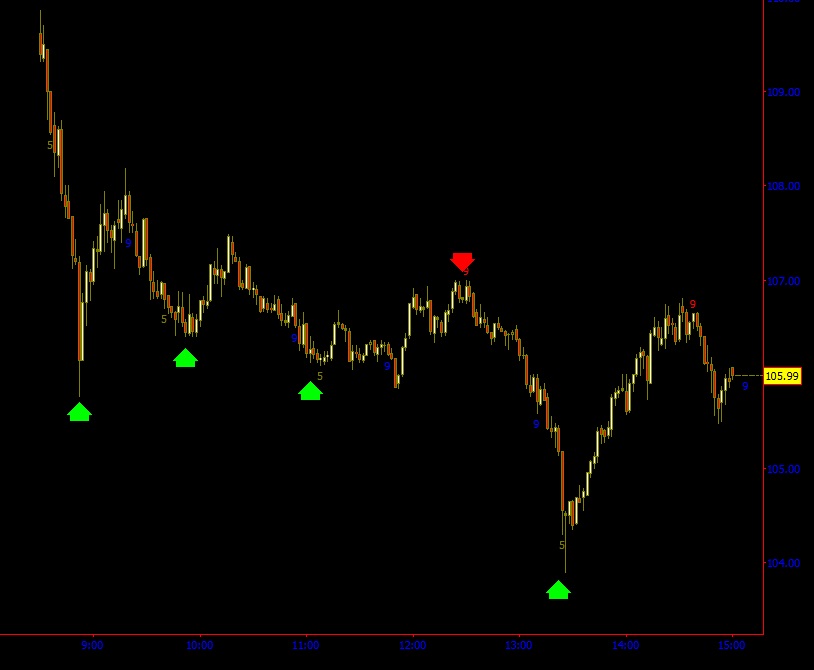
The next chart below is a 2 minute chart of the stock BABA for December 1st. Again, the arrows are drawn before the trading day and forecast turn times. Pretty good:)
DISCLAIMER: The examples above are given as demonstrations of technical analysis and are therefore hypothetical and not actual trades. They do not represent actual Software results nor include the entirety of all predictions we make.