
The Blog of Arcanum Market Research
W. D. GANN’S “POLARITY LINE” TECHNIQUE
The following galleries show a stand-alone trading technique using W. D. Gann’s ‘Polarity Lines.’ Gann also referred to these as ‘Resistance Levels’ in “The Stock Market Course.” This technique was illustrated by Robert Gordon’s “Major Motors Campaign” in Tunnel Thru The Air. Below you will find a few years worth of entry signals for the annual polarity lines for the S&P 500 and 2016 gold and crude, and intraday soybean futures, applying W. D. Gann’s rules for this technique. The missing months represent months where there was no entry signal. That happens with Gann. Note that in both these examples there wasn’t a bad signal. See below the galleries for further explanation.
Read more information about W. D. Gann’s polarity lines on our main website, Arcanum Market Research.
DISCLAIMER: The examples below are given as examples of technical analysis and are not actual trades or account results. Do not trade or invest based on any information on this page- it is an incomplete explanation of the techniques shown. Charts source: Wave59.
S&P 500 ANNUAL POLARITY LINE ENTRY SIGNALS 2014 – 2017


2016 GOLD MONTHLY POLARITY LINE ENTRY SIGNALS


2016 CRUDE OIL QUARTERLY POLARITY LINE ENTRY SIGNALS


The polarity line technique is incredibly simple to implement. One price that determines breakout/breakdown. Used as a stand-alone technique, once Gann entered, the targets and stops are the same in the timeframe he was trading. But behind the scenes there is a bit more going on to calculate these lines. Look at the line on the chart below. It is a ‘polarity price.’ The polarity prices attract the price to them, then repels it to the next line if price can successfully close above or below the present line on the timeframe in question. These prices change at predetermined intervals, and can be calculated far in advance before the market data even exists. After the first daily bar, when a price bar closes above or below that polarity price, Gann would enter in the direction of the close. We can’t show you exactly where the target is each time or a couple other factors on the chart, but the target and stop loss is a definite price each time known in advance of the trade entry.
After the entry, if price moves halfway to the target, Gann moved his stop one polarity line to the other side of the entry price. Simple. If target was not achieved, Gann would close each trade at the end of the day, week, month or quarter for the respective systems. If his first trade was a winner or break-even, he stopped for that time period. If the first trade lost, Gann then took the next setup that month as it appears. This is just one of the ways Gann used these “Resistance Lines” he discovered.
Below is a gallery of intraday signals on soybean futures; Gann’s technique applied to a modern market and timeframe. Same setup on this 2-min chart of the November 2018 contract, but this time you would avoid the first 6 minutes. When beans closes above or below the polarity line for the first time, the energy will propel it farther. When the contract cooperates, entry is signaled. This level is drawn prior to the open of the market and is different every trading day. The recipient of this seminar will learn how to calculate the signal line each day. No matter what the market does, you usually get one signal every day. And when you don’t, its telling you to stay out of the market! Note: this was updated on June 20th. We simply took the last 8 days in a row, so no cherry picking.
SOYBEAN INTRADAY POLARITY LINE ENTRY SIGNALS


Out of the last 8 days, 6 wins, 1 no-trade signal, and one breakeven. This is not uncommon. We challenge our recipients to find a losing month with beans or crude intraday- going back as far as they want. So far no takers. Gann’s results in his “Stock Market Course” showed these work more often that not over time. But you may say, “Where are the Gann Fans and cycles?” That’s the thing. Gann traded this technique as a stand-alone mainstay, and really pushed this to his students toward the end of his life.
These lines can also be applied to US Indexes, gold futures, soybean futures, Euro futures, 30 year bond futures, and crude oil futures in several timeframes.
FORECASTING PRICE AND TIME
DISCLAIMER: The examples of predictions and calls below are given as demonstrations of technical analysis and are therefore hypothetical and not actual trades. They do not represent actual account results. These examples don’t include all the predictions and calls we make. We look for market confirmation into a turn time or predicted price to consider the signal valid, and occasionally the market prices “inside” at these times, rendering the signal invalid.
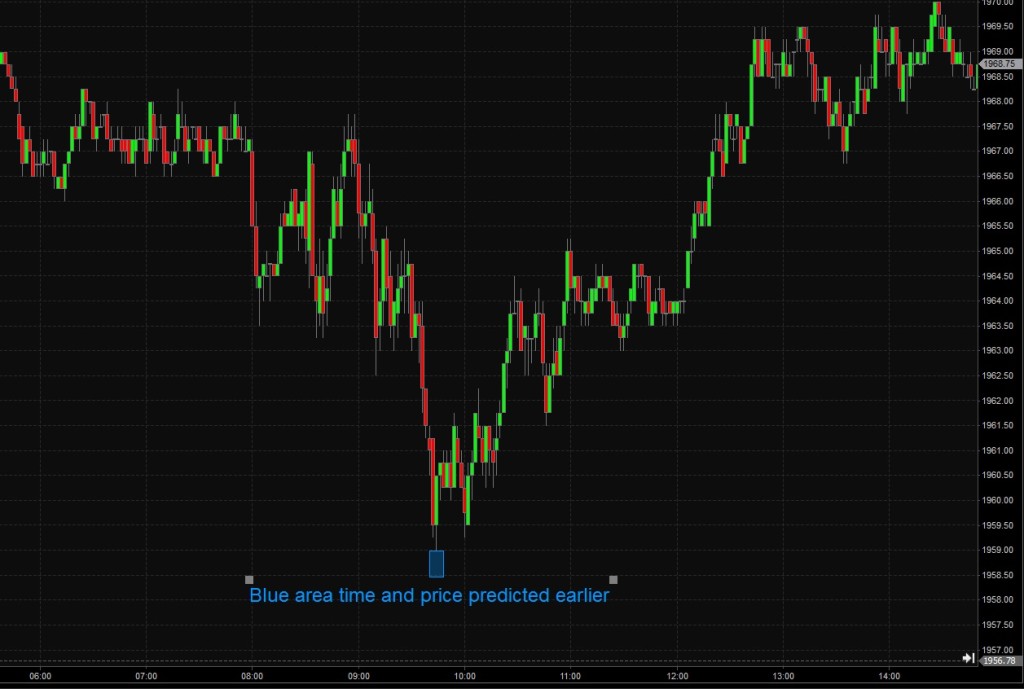
![]()
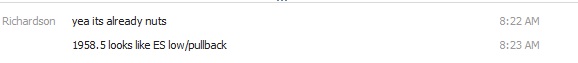
The above chart is of the ES $S&P futures contract for Monday, July 21st. On the chart, the price and time bottoms at 1859 at 9:48 right on the blue rectangle. Under the chart are transcripts. Reference the predicted prices and times of day (CST) the call and predictions were made. At 9:06 we forecast the 9:48 bottom to the minute. Before the market opened, we forecast the bottom price of 1958.50, which occurred at the 9:48 bottom time…only 2 ticks off! Impossible? Gann would do this on just about every trade he took. And he didn’t have a calculator back then.
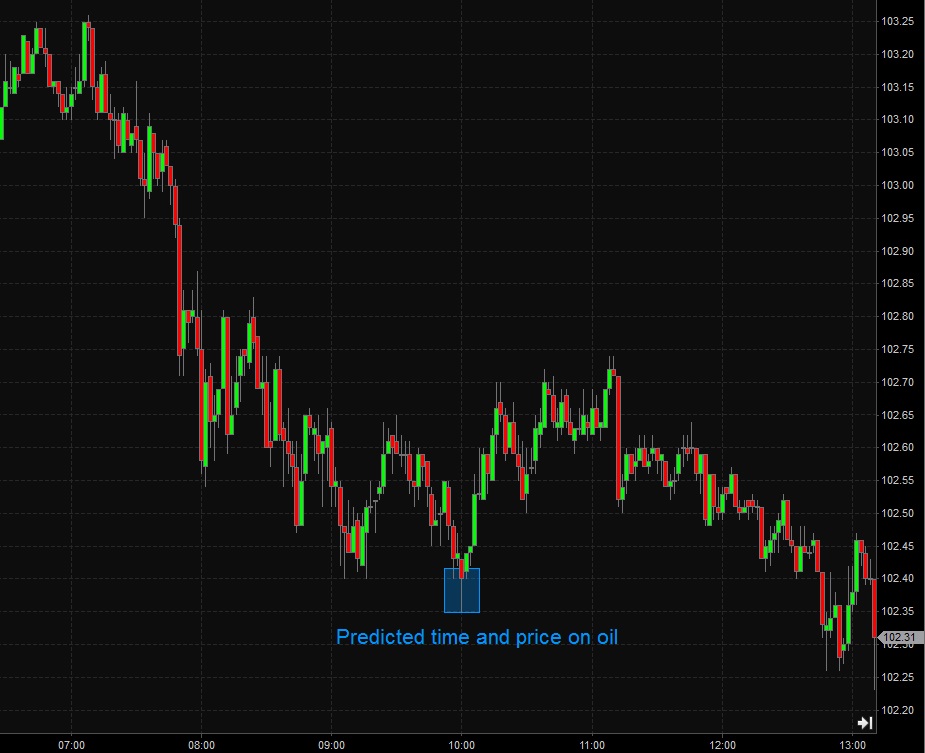
![]()
On the above crude oil chart notice the blue area of the price and time bottom. At 8:52 CST (over an hour earlier) we were able to accurately forecast the first bounce time on oil in our Market Elixir service. Earlier we also alerted our clients to that area due to several large moving averages and a Gann price predicted bounce level. These occurrences are prevalent. And again, you too can learn this lost craft in our “W. D. GANN: MAGIC IN THE MARKETS” Course.
back